Charting
Just like we saw the grid integrating with MUI, Ant, and others earlier in the tutorial, the grid also integrates with charting libraries. This tutorial will show you how to integrate the grid with
Setup
This tutorial assumes that you have the underlying charting library installed and configured in your application. If you don't, please refer to the documentation for the charting library you want to use. At the time of writing, we provide adapters for Highcharts and Recharts, but we plan to add more in the future. Adapters are very easy to write, so if you want to use a charting library that we don't support, its very easy to write your own adapter by looking at the source code for the existing adapters.
Highcharts
First, we need to install the Highcharts adapter:
npm i @ezgrid/grid-adapter-highcharts
Next, we need to import the adapter and register it with the grid:
import {highchartsAdapter} from "@ezgrid/grid-adapter-highcharts";
    gridOptions: {
        ...gridOptions,
        behaviors: createBehaviors(),
        chartLibraryAdapter : highchartsAdapter({}),
    },
Recharts
First, we need to install the Recharts adapter:
npm i @ezgrid/grid-adapter-recharts
Next, we need to import the adapter and register it with the grid:
import {rechartsAdapter} from "@ezgrid/grid-adapter-recharts";
    gridOptions: {
        ...gridOptions,
        behaviors: createBehaviors(),
        chartLibraryAdapter : rechartsAdapter({}),
    },
Chart Builder
Now that we have the adapter installed and registered, we can use the grid's built in charting capabilities. First, we need to enable the charting UI:
    const gridOptions = useMemo<GridOptions<LineItem>>(() => ({
        ...
        toolbarOptions: {
            ...
            chartBuilderRenderer: ({ node } : {node:VirtualTreeNode}) => <ChartBuilder node={node} />,
            ...
        },
This will enable a new button in the toolbar that looks like this:
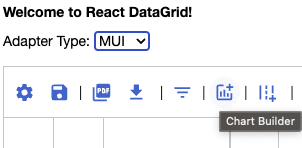
Clicking this button will open the chart builder UI:
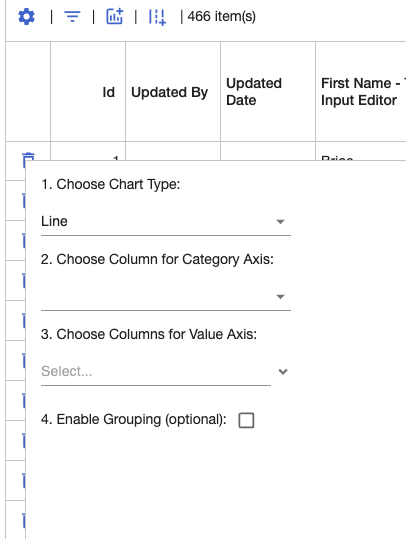
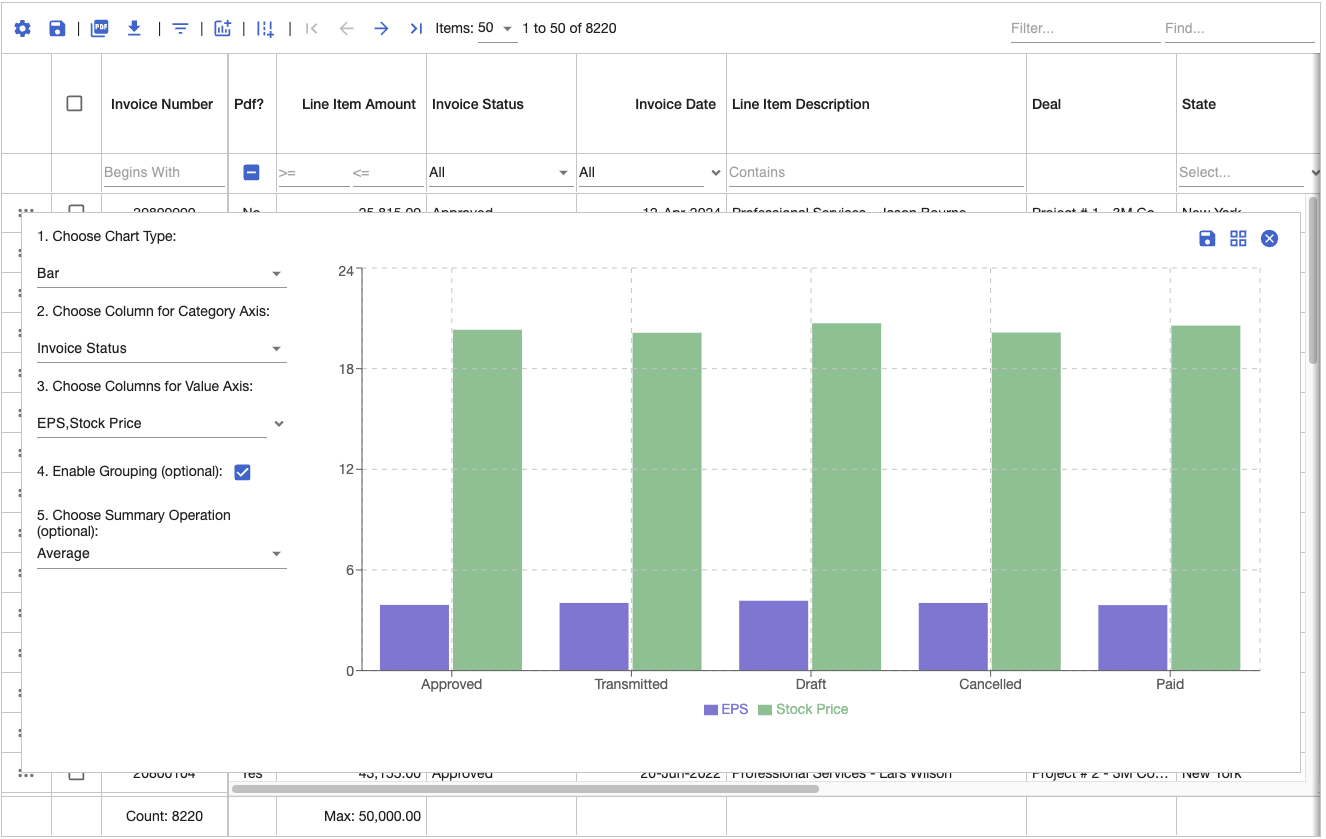
Selecting values, and clicking the "Build Chart" button will build a chart and display it in the grid. The chart is integrated with the grid's powerful filtering and searching capabilities, so you can filter and search the data, and the chart will update automatically. You can also click the "Chart Settings" button to change the chart type, chart size, and chart columns. The chart builder UI will look like this :
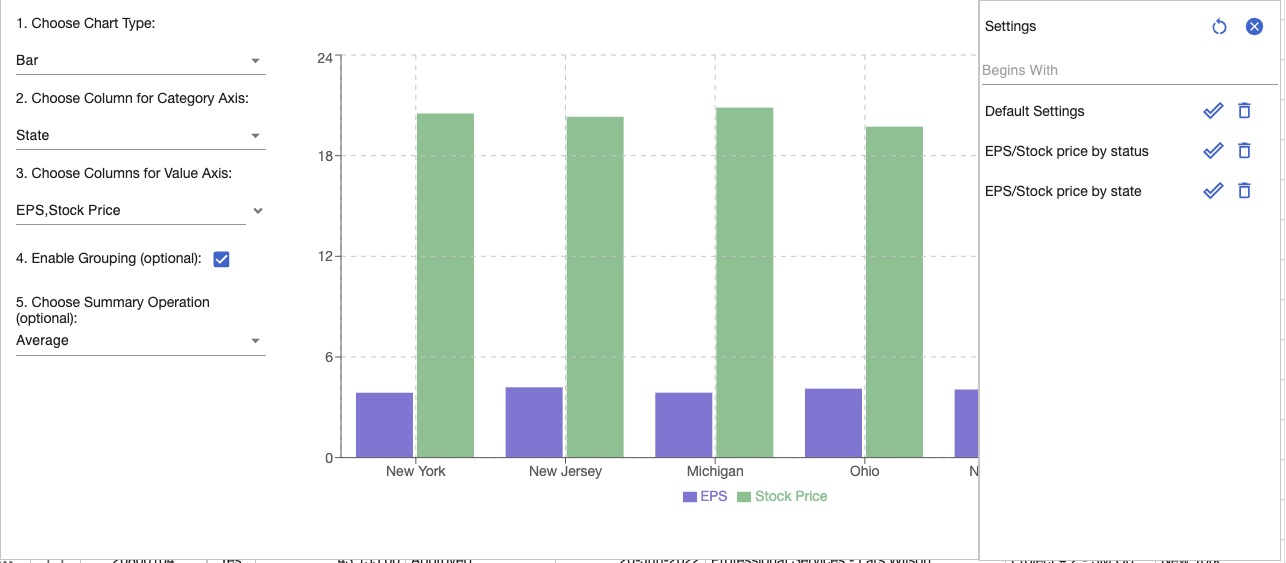
Saving Charts
The chart builder UI allows you to save charts to the grid's state. This allows you to save charts and restore them later. To save a chart, click the "Save Chart" button in the chart builder UI. This will open a dialog that allows you to name the chart. Once you have named the chart, click the "Save" button. This will save the chart to the grid's state. In the future, you can restore the chart by clicking the "Chart Settings" button in the chart builder UI. This will open a dialog that allows you to select the chart you want to restore.
Custom Chart Adapters
Writing chart adapters is very easy. Let's look at the source code for the Recharts adapter:
import { ChartLibraryAdapter, ChartLibraryAdapterTemplate, ChartType, parseNumber, resolveExpression } from "@ezgrid/grid-core";
import { Area, AreaChart, Bar, BarChart, CartesianGrid, Legend, Line, LineChart, Pie, PieChart, Tooltip, XAxis, YAxis } from 'recharts';
const strokes = [
    "#8884d8",
    "#82ca9d",
    "#ffc658",
    "#ff7300",
    "#000000",
    "#00ff00",
    "#ff0000",

];
export const rechartsAdapter= (template:ChartLibraryAdapterTemplate):ChartLibraryAdapter=> ({
    downloadChart: (chartOptions) => {
        return template?.downloadChart?.(chartOptions);
    },
    createChart: (chartOptions) => {
        if(template?.createChart) return template?.createChart?.(chartOptions);
        const chartType = chartOptions.chartType;
        const categories = chartOptions.chartGroupColumn ? chartOptions.data.map((row) => resolveExpression(row, chartOptions.chartGroupColumn!.dataField)) : [];
        const data = chartOptions.data.map((row, idx) => {
            const retVal: any = {
                name: categories[idx]
            };
            chartOptions.chartColumns.forEach((col) => {
                retVal[col.headerText] = parseNumber(resolveExpression(row, col.dataField));
            });
            return retVal;
        });
        const { width, height } = chartOptions.chartSize;

        if (chartType === ChartType.Line) {
            return <LineChart width={width} height={height} data={data} margin={{ top: 5, right: 20, bottom: 5, left: 0 }} ref={chartOptions.chartRef}>
                {
                    chartOptions.chartColumns.map((col, sid) => {
                        return <Line type="monotone" dataKey={col.headerText} stroke={strokes[sid % strokes.length]} key={col.headerText}  />
                    })
                }
                <CartesianGrid stroke="#ccc" strokeDasharray="5 5" />
                <XAxis dataKey="name" />
                <YAxis />
                <Tooltip />
                <Legend />
            </LineChart>

        } else if (chartType === ChartType.Area) {
            return <AreaChart width={width} height={height} data={data} margin={{ top: 5, right: 20, bottom: 5, left: 0 }} ref={chartOptions.chartRef}>
                {
                    chartOptions.chartColumns.map((col, sid) => {
                        return <Area type="monotone"   dataKey={col.headerText} stroke={strokes[sid % strokes.length]}  fill={strokes[sid % strokes.length]} key={col.headerText}  />
                    })
                }
                <CartesianGrid stroke="#ccc" strokeDasharray="5 5" />
                <XAxis dataKey="name" />
                <YAxis />
                <Tooltip />
                <Legend />
            </AreaChart>
        } else if (chartType === ChartType.Pie){
            return <PieChart  width={width} height={height} ref={chartOptions.chartRef}  >
                {
                    chartOptions.chartColumns.map((col, sid) => {
                        return <Pie dataKey={col.headerText} data={data}  fill={strokes[sid % strokes.length]} key={col.headerText} labelLine={false}/>
                    })
                }
                <Tooltip />
            </PieChart>
        }

        return <BarChart  width={width} height={height} data={data} margin={{ top: 5, right: 20, bottom: 5, left: 0 }} ref={chartOptions.chartRef}>
                {
                    chartOptions.chartColumns.map((col, sid) => {
                        return <Bar dataKey={col.headerText}   fill={strokes[sid % strokes.length]} key={col.headerText} />
                    })
                }
                <CartesianGrid stroke="#ccc" strokeDasharray="5 5" />
                <XAxis dataKey="name" />
                <YAxis />
                <Legend />
                <Tooltip cursor={{opacity: 0.2}} />
            </BarChart>

    }
});
```ts


As you can see, the adapter is just a function that takes a `ChartLibraryAdapterTemplate` object as a parameter, and returns a `ChartLibraryAdapter` object. The `ChartLibraryAdapterTemplate` object contains the following properties:

```ts
export interface ChartLibraryAdapterTemplate {
    createChart?: (chartOptions: ChartOptions) => ReactNode;
    downloadChart?: (chartOptions: ChartOptions) => void;
}
The createChart function is called when the grid needs to create a chart. The downloadChart function is called when the grid needs to download a chart. Most of the code above is just parsing the data from the grid into a format that the charting library can understand. The only part that is specific to Recharts is the actual charting code. You would need to write similar code for the charting library you want to use.
If you are using a library other than Highcharts or Recharts, please reach out to us, we have unpublished adapters for other libraries that we can publish if there is interest.
Conclusion
In this tutorial, we covered how to integrate the grid with charting libraries, and how to use the grid's built in charting capabilities. We also covered how to save charts to the grid's state, and how to restore them later. Finally, we covered how to write custom chart adapters for charting libraries that we don't support out of the box. We chose to use external charting libraries instead of writing our own charting library, because there are already many great charting libraries out there, and we didn't want to reinvent the wheel. Chances are you are already using a charting library in your application, so this approach allows you to have gorgeous charts, integrated with the robust filtering and searching capabilities of the grid, all in one place without bloating your bundle size with an additional charting library. It allows your application to have a consistent look and feel, it allows you to use the same data for both the grid and the charts, all the while reducing your bundle size, and making your application more performant.